
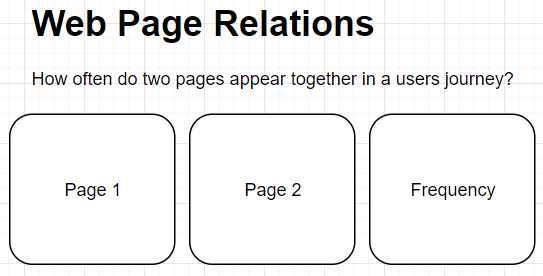
This post outlines a method for analyzing how often pages appear together in user journeys on your website. To do so we utilize R and the Google Analytics API. You can find the full code on GitHub.
We will rely on the dplyr, plyr, GoogleAnalyticsR, rio, RcppAlgos, and data.table packages.
###############################
## Imports
###############################
imports <- c('dplyr', 'plyr', 'GoogleAnalyticsR', 'rio', 'RcppAlgos', 'data.table')
invisible(lapply(imports, require, character.only = TRUE))
First we must get our data from Google Analytics. We structure this data such that our dimensions include landingPagePath, secondPagePath, exitPagePath, and previousPagePath. Users will be our metric for these dimensions. Although this does not include all steps within a user journey, this provides a good base for inference for related pages at the beginning and end of user journeys.
###############################
## Authentication and API Request
###############################
ga_auth() #Autorization for access to Google Analytics Account
# Google Analytics API Data Request
# Observe the metrics and diminesions needed for analyzing page relations
my_id <- 'your_id_goes_here' # Put your Google Analytics Account ID Here
dates <- c('2018-21-01', '2018-12-31') # Edit the date range to your preference
web_data <- google_analytics_4(my_id,
                                date_range = dates,
                                metrics = c("users"),
                                dimensions = c("landingPagePath",
                                               "secondPagePath",
                                               "exitPagePath",
                                               "previousPagePath"),
                                anti_sample = TRUE
)
Once we have our data we need to make some changes before we can begin counting frequencies. First we must change the data from the wide format (i.e. 1 row for each unique path containing the number of users) to the long format (each user gets its own row for every unique path). We do this with a helper function UsersWide2Long.
UsersWide2Long <- function(x){
  # Transform 'wide' web data to 'long' web data. The API Query will return multiple users per path
  # This function replicates rows by the number of users that have taken a path then removes the user
  # column from the long data.
  # Args:
    # x: A dataframe returned by the google_analytics_4 function
  # Returns: long data.table
  dt <- data.table(x) # Retype x as a data.table object
  dt <- dt[rep(seq(1,nrow(dt)), da$users)] #replicate rows by number of users
  dt$users <- NULL # Remove users column
  dt
}
Next for every row we need to generate all combinations possible of 2 selections of landingPagePath, secondPagePath, exitPagePath, and previousPagePath. We utilize the helper function PathCombinations.
PathCombinations <- function(x){
  # Generate all combinations of a path without repition
  # This is a convinience wrapper function for the comboGeneral function
  data.frame(comboGeneral(v = x, m = 2, repetition = FALSE), stringsAsFactors = FALSE)
}
Now we bring everything together with some functional programming and plyr’s count function to display frequencies for every unique combination.
###############################
## Data Priming and Output
###############################
y <- UsersWide2Long(web_data)
output <- apply(y, 1, PathCombinations) #apply to data.table, will return list of data frames
output <- rbindlist(output) #bind the dataframes in the list together
output <- plyr::count(output) #produce data frame with rows displaying frequencies of 2 pages occurring in the same path
This next step is optional however it can greatly improve readability. Using dplyr’s filtering we remove rows where either of the following are true:
- the same page is related to itself
- a page is an entrance
- a page is the homepage
- a page is (not set)
# Remove rows where:
# 1. the same page is related to itself
# 2. a page is an enterance
# 3. a page is the homepage
# 4. a page is (not set)
output_subset = output %>%
  select(X1, X2, freq) %>%
  filter(X1 != X2) %>%
  filter(X1 != "(entrance)")%>%
  filter(X1 != "/") %>%
  filter(X1 != "(not set)")
Finally, we can sort rows by frequency in descending order and export the results to csv.
# Order rows in descending order
output_subset <- output_subset[order(-output_subset$freq), ]

# Export page relations to csv
export(output_subset, "page_relations.csv")